Cost Reports
Do an Invoice
crontab automatically runs
Prepare it for June
Cluster invoice tracking sheet https://docs.google.com/spreadsheets/d/1SLG5diMGErTQ9zImqwvdGk-e4mfVdx7_jJQQilDL2FU/edit?gid=386463404#gid=386463404
How to calculate schmit science hours 40 GPUs * 24 hours / day *30 days/month
Double check which users are under schmit science
ubuntu@cais-controller:/opt/oci-hpc/billing$ ./invoice.sh | grep 2025-06 | grep Weka
10022,bo_li,2025-06,Weka,Filesystem,0.0004000000,961922.3088,384.76892351201280
10027,david_krueger,2025-06,Weka,Filesystem,0.0004000000,1889371.8588,755.74874350059520
10064,apollo,2025-06,Weka,Filesystem,0.0004000000,572590.4589,229.03618356674560
10082,schmidt_sciences,2025-06,Weka,Filesystem,0.0004000000,0.0300,0.00001200783360
10083,zhijing_jin,2025-06,Weka,Filesystem,0.0004000000,104126.1515,41.65046060974080
10084,eugene_bagdasarian,2025-06,Weka,Filesystem,0.0004000000,110987.4524,44.39498094510080
10085,mykel_kochenderfer,2025-06,Weka,Filesystem,0.0004000000,0.0472,0.00001886945280
10086,fazl_barez,2025-06,Weka,Filesystem,0.0004000000,63023.8383,25.20953533235200
10087,daniel_kang,2025-06,Weka,Filesystem,0.0004000000,127678.6028,51.07144111554560
10089,sijia_liu,2025-06,Weka,Filesystem,0.0004000000,0.1342,0.00005366906880
127678.6028+63023.8383+0.0472+110987.4524+104126.1515+0.0300+572590.4589+1889371.8588+961922.3088
The last row sijia_liu is not part of schmitt science. Double check on airtable who should and should not be.
We manually sum the second to last column. The columns are roughly the following: UserID, user account name, date, Measurement type, Measurement type, The cost per unit, The usage, The cost per unit * the usage
Do the same for Egress
OCI Cost Report
The cost Report below is what our intern Rumiah worked on before. It gets the data from OCI and checks where our spending is going and be able to track it.
Understanding the Cost Report
Overview
This sheet provides all the relevant overview information for a general understanding of our cost breakdown with the overall summary at the top and a monthly breakdown right below that. Then each service is broken down below with the main 3 having detailed graphs.
Cost By Service
This sheet fuels the overview page and has more detailed daily and weekly information broken down by service.
User Cost
This sheet gives a rough estimation of our biggest spenders for both compute and storage systems.
The GPU section is broken down by all time usage and has both what we would be paying if we payed per hour (A100 Cost for hours), what percentage of our total GPU time that user has used (Percentage), and then what we are paying based on that percentage of our production costs for compute (Cost Based on Percentage of Total).
The File Storage section gives a breakdown based on how much each user is currently using and what the projected monthly and daily cost is for storing that user's data.
Projection
This sheet gives a quarterly projection for costs and breaks down our greatest increasing cost sector (File Storage).
Usage and Rate Cost
This sheet provides the usage on a day to day detail and then shows the rate we are paying and the total cost of that shape. Far to the right in this same sheet you can find graphs for overall breakdown of cost by shape as well as a breakdown of our compute rates.
Cost by Shape
This sheet is nearly identical to the previous one but shows the cost instead of usage in the main table
Rate each Day
This sheet is entirely for validating that our rates aren't changing day to day and that we are getting the rates we are contracted for
Understanding the Oracle Cost System
Under the Billing & Cost Management tab there is a Cost Analysis tool, which is extremely helpful for generating any kind of cost report. The tool has a couple major options:
Reports
This section allows for a couple different templates for levels of granularity of the services.
Costs by Service breaks down the cost into service categories (Compute, Block Storage, File Storage, etc.).
Costs by Service and Description breaks down the larger categories into the individual component shapes i.e. (compute/A100, compute/A10, etc).
Costs by Compartment breaks down the cost based on compartment, but it has some limitations in how detailed it can get within a compartment (i.e. compute vs file storage), so I found it easier to use the grouping dimensions I will mention later to group by resource OCID.
Dates & Granularity
The date ranges are fairly self explanatory except that if you select a range spanning more than 3 months you can no longer select Daily granularity. You can get around this by just concatenating multiple ranges in Excel.
Show
This allows you to select Usage (in GB months or GPU/OCPU/Memory hours) or Cost as the metric to represent. Can mainly be used for validating the real world rates are accurate to the contracted rates.
Grouping Dimensions
The core method of selecting the granularity of the data in the report and is usually selected when you select the Reports option, but there are several options here that are useful, such as grouping by resource OCID.
Cost Details
The primary section that gives a graphical representation of an underlying CSV file. This underlying CSV can be downloaded under the Tab Actions option and can easily be imported into Excel or google sheets to create a more detailed cost report
Updating the cost Report
Cost by Service and Overview
This sheet can be updated by simply downloading the csv under cost by service for the appropriate 3 month time frame (or concatenated if longer). Note that the pasted data will be in reverse order. You can fix this easily by adding another counter column next to the date that counts by 1 and sorting the whole table based on that column (Data->sort Range->Sort by Column).
The only things that need to be manually updated here are the ranges for the weekly and monthly averages and where those cells are placed. Some things will also need to be updated on the Overview Sheet. Namely the ranges of the graphs, the number of days used in the Daily AVG calculation and the Summary calculations, and finally the referenced cell in the Total column and Summary Total row.
User Cost
Need to run a couple scripts using the ocp user to collect data.
Now you have gpu usage per user in seconds in ~/logs/cost_report.json and file system usage by user in ~/logs/fss_du.log.
Projection
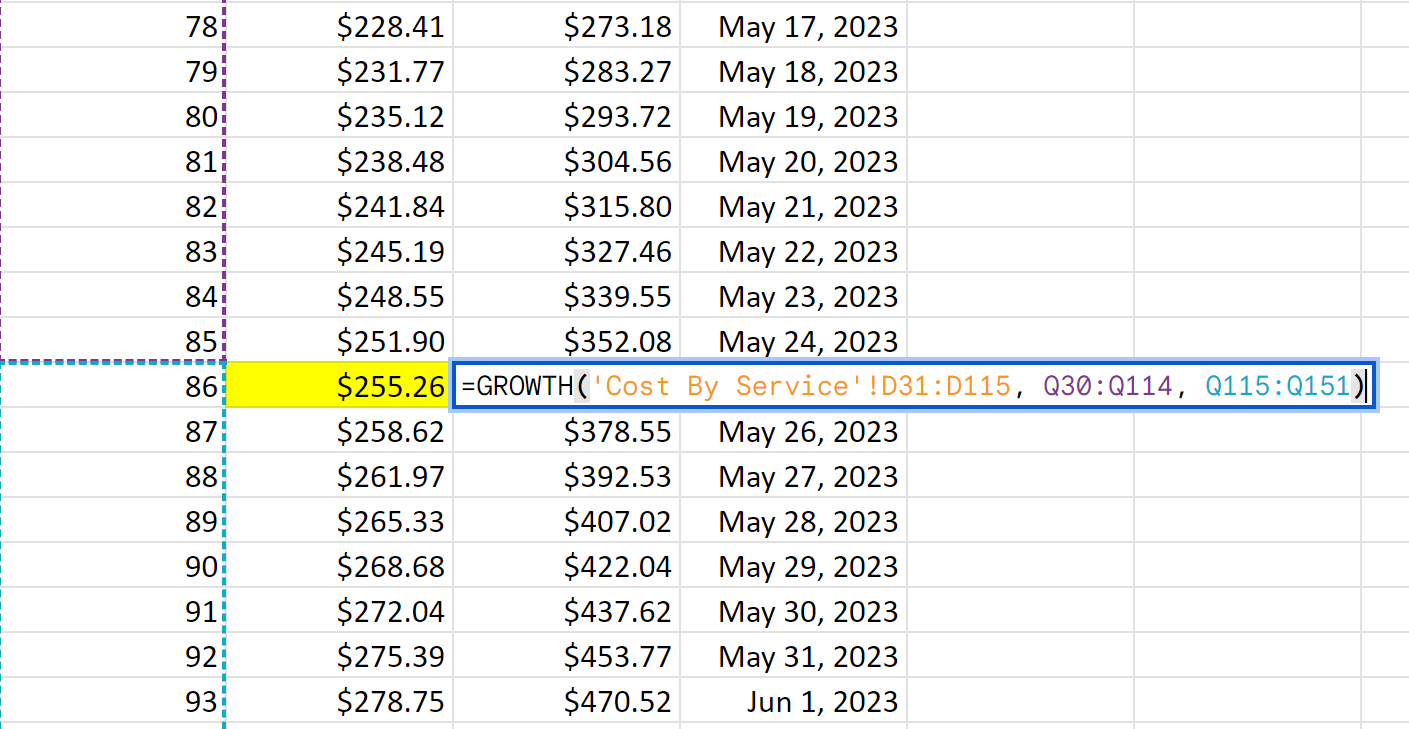
To update the Projection Slide First update the Daily average column of each Service. This is generally done by averaging a past time frame for services expected to remain constant. However, File Storage should be done using the Most accurate Projection. See past column P there are a linear and exponential fit for the File storage. Adjust the ranges in the first row to Match all your known data from the Cost By Service sheet. Then at the end of that data add a copy of the first function but add the indices for the known data and the indices for the predicted data in the next two arguments as seen below.
 Now, update the graph with the data range from the Cost By Service sheet for the data range of the blue line. Then update the two fit lines with the data range for the linear and exponential fits.
Usage and Rate Cost
Download the table for Service and Description and select Usage instead of Cost. Reverse it as described in Cost by Service and paste it. Line up the columns to be the same as the original so you don't need to adjust references (This is much easier than adjusting references as they are alphabetical).
Cost by Shape and Rate each Day
Do all the same as above for Cost by Shape but select cost instead of usage. Rate each day should auto populate based off of the previous two sheets but you may have to adjust the dates to line up.
(Computation) Cost by ID
This is a purely computational sheet used to generate the development costs. You can download costs split by compartment but they don't allow you to subdivide them by service hence this sheet allows you to change things by OCID. Change the group field of the table to go by resource id and download the csv then paste it into the above sheet. Then go through and ensure compute, file storage, and block storage either have a production id list or a dev id list and that they contain all the correct OCID. If you need to add or remove any then you will have to update the overview page with the new references to totals.